HDCMD: a Clustering Algorithm to Support Hand Detection on Multitouch Displays

Bojan Blažica, Daniel Vladušič & Dunja Mladenić

Abstract

This paper describes our approach to hand detection on a multitouch surface i.e. detecting how many hands are currently on the surface and associating each touch point to its corresponding hand. Our goal was to find a general software-based solution to this problem applicable to all multitouch surfaces regardless of their construction. We therefore approached hand detection with a limited amount of information: the position of each touch point. We propose HDCMD (Hand Detection with Clustering on Multitouch Displays), a simple clustering algorithm based on heuristics that exploit the knowledge of the anatomy of the human hand. The proposed hand detection algorithm’s accuracy evaluated on synthetic data (97%) significantly outperformed XMeans (21%) and DBScan (67%).

[Link – Springer]

Enhancement of Web Application Design of the Open Platform for Clinical Nutrition

Peter Novak, Franc Novak & Barbara Koroušić Seljak

Abstract

In this paper, an enhancement of a web application design is presented. The aim was to modify the visual quality of the application in order to make it simple and visually more easy to understand, which consequently leads to improved user experience. The process of enhancement of user interface of the web application home page and subsequent web pages is based on different methods for establishing clear visual hierarchy of presented information, among them the methods of reduction, regularization and leverage. The web application to which the above principles were applied is Open Platform for Clinical Nutrition, which offers to users effective means for identifying their nutritional state and adjusting diet plans to their way of life and clinical state. Currently, the application has about 3000 active users.

[Link – Springer]

Interactive Visual Analysis – IVA

Just a few notes from Helwig Hauser‘s keynote at SouthCHI2013 titled: »Integrating interactive and computational analysis in visualization.«

Firs, he defined visualization as computer assisted means to enable insight into data. In research, visual analytics have been a hot topic since 2004. Based on the level of integration of visualization and interaction, visual analytics tools can be divided in the following 3 (or is it 4?) categories:

  • level 0: no integration,
  • level 1a: visualization of results,
  • level 1b: making computational analysis interactive,
  • level 2: tight integration.

The last level is the one with most potential for research.  He continued by presenting the IVA methodology and the IVA loop. Some remarks about the IVA methodology (and tools for interactive visual analytics): it is needed when the user is faced with too much or too complex data; it should support data exploration, data analysis, hypotheses generation and sense making; it should take into account user interests and task at hand; it should support ‘information drill-down’ (i.e. going from overview to details); and it should offer an interactive and iterative visual dialog. The basic IVA loop consists of two steps: visualization (the computer shows the data to the user) and interaction (the user tells the computer what he/she is interested in). It sounds simple, but the execution of these two steps can quickly get complicated and complex – keep in mind that the process must run in real-time to be interactive.

For more on the topic, see Helvig Hauser’s bibliography.

Kinect Web Kiosk Framework

Ciril Bohak & Matija Marolt

Abstract

In this paper we present a web kiosk framework based on Kinect sensor. The main idea is to use the framework for creation of simple interactive presentations for informing, advertising and presenting knowledge to the public. The use of such a framework simplifies adaptation of existing web materials for presentation with the kiosk. We can also make use of touchless interaction for browsing through the interactive content, to animate the user and encourage her to spend more time browsing the presented content. We present the structure of the framework and a simple case study on using the framework as an interactive presentation platform and as an education resource. The developed framework has been used for presenting information on educational programs at Faculty of Computer and Information Science, University of Ljubljana.

[Link – Springer]

HCI-SEE

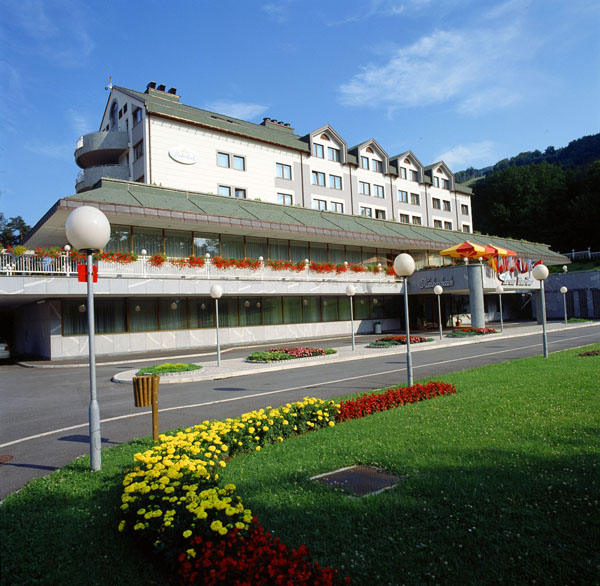
The first event organised by hci.si was successfuly concluded as a workshop at the SouthCHI conference in Maribor. The whole conference took place at hotel Habakuk from the 1st to the 3rd of July 2013. The conference had broad international participation from the HCI community.

Three approaches from community members were presented at the workshop:

pictures_program_1_2006_Habakuk_MB_zunanjost_86512